
Did you know that header bidding was originally called “Tagless”?
According to the VP of Index Exchange, it was 2015 when header bidding got momentum in the ad tech industry. Similarly, if you see the Google Trends reports, header bidding search queries took off in 2015, roughly around the same time when AdExchanger published the article “The Rise of Header Bidding and The End of Waterfall”.
As you know, the header bidding technique enables publishers to offer their ad impressions to multiple SSPs simultaneously before even making an ad call to the server. Meanwhile, buyers also get greater access to the publishers’ premium inventories with higher transparency and efficiency.
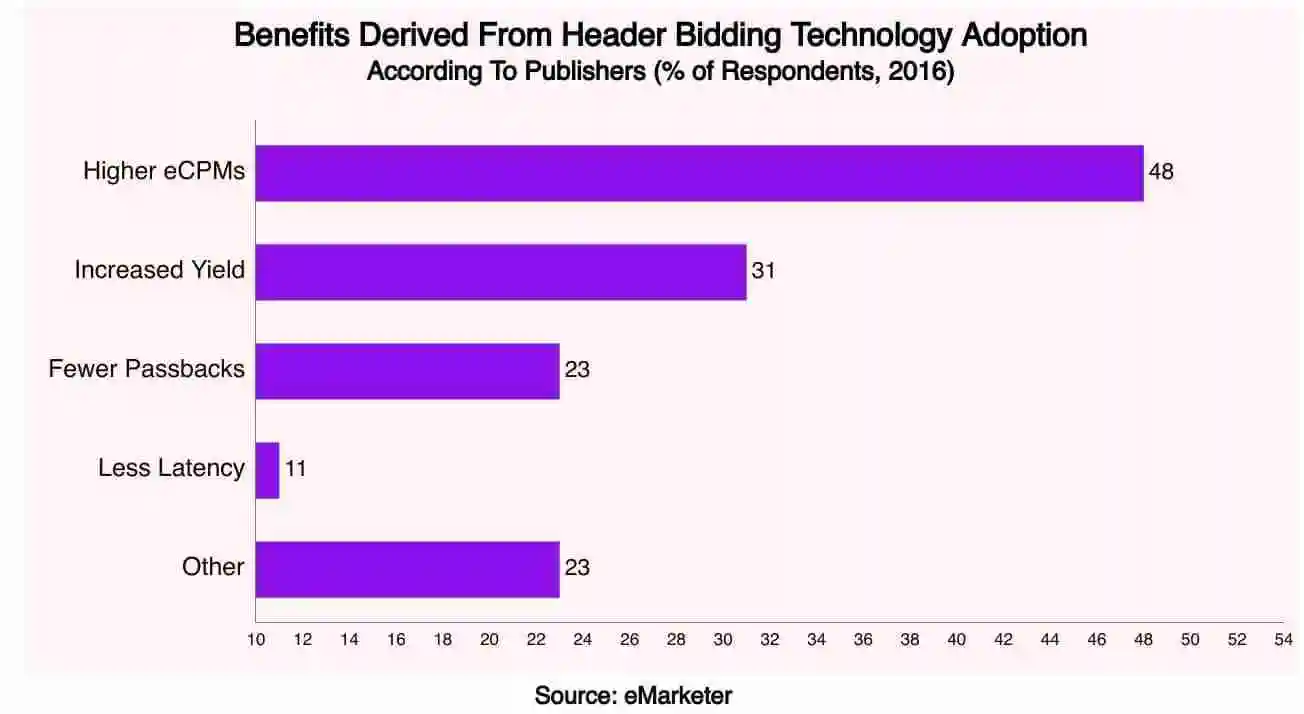
Despite initial latency issues, header bidding has grown and gained popularity. By the end of 2016, header bidding accounted for 73% of total digital ad spending according to a report published by eMarketer and 48% of respondents agreed they received higher CPMs than the waterfall method.
Let’s look at some of the interesting header bidding statistics that will help you understand the prevalence of the method in the industry today.
Table of Contents
Header Bidding Adoption
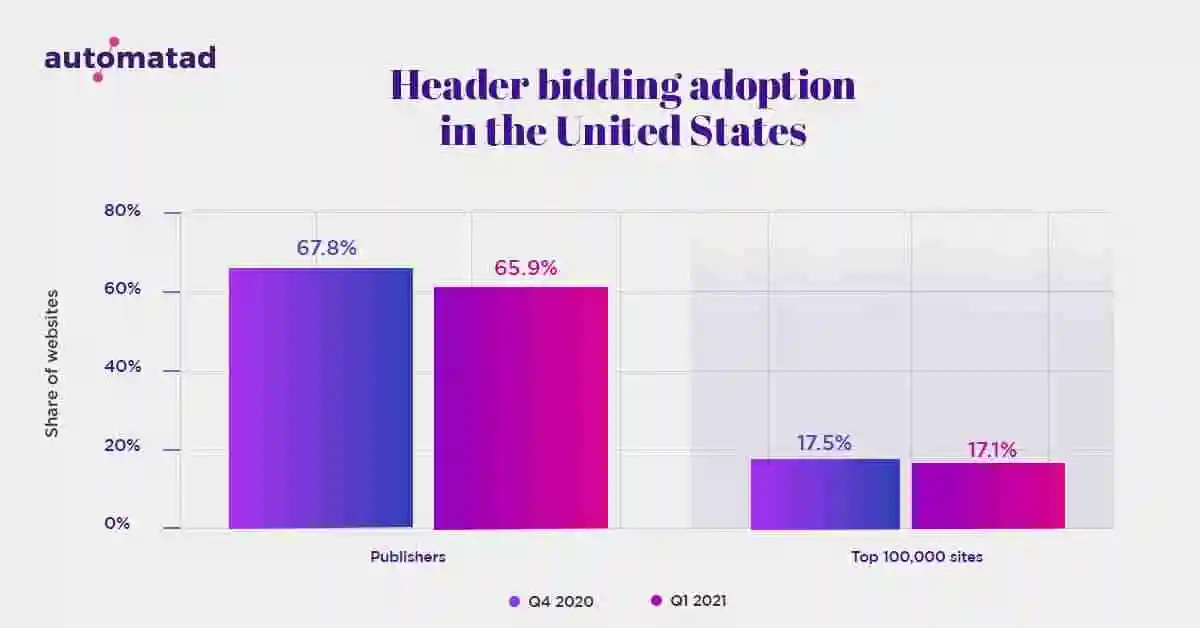
– In Q2 2021, 66.7% of publishers are using header bidding to monetize their inventories. According to Kevel’s hbix, the adoption rate of header bidding has increased by 1.2%.
So, is header bidding going to grow even after Google Ad Manager’s shift to unified first-price auctions?
Indeed. Curious to know why?
Because more than half of US publishers have agreed that they obtained higher CPMs with header bidding. Further, eMarketer did a thorough analysis and showed that 31% of total publishers witnessed an increase in their yield (Src).
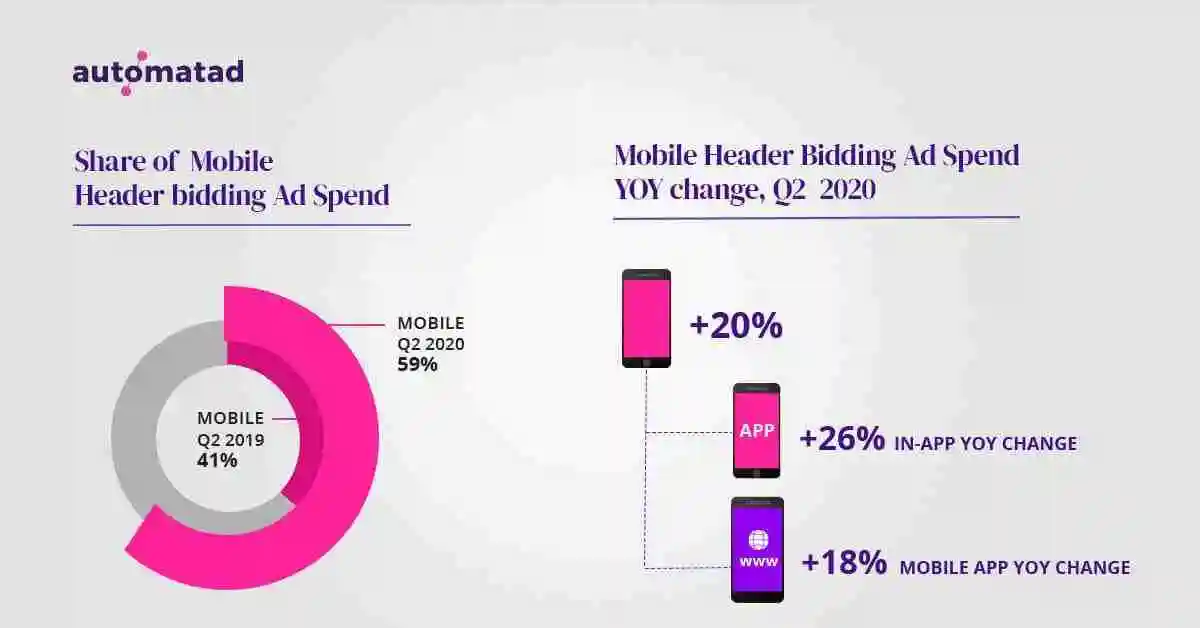
– Besides, the rise of header bidding not only impacted desktop web advertising but also mobile web advertising. According to a report published by Pubmatic, 59% of total impressions were served on mobile devices, 18% up from the previous year (Src) and it is expected that mobile advertising will grow in the coming few years.
Related Read: If you’re wondering about the niche of the publishers who have adopted header bidding and how much average eCPM they get, then here’s a study done by us. We’ve studied over a billion ad impressions to analyze eCPMs for various niches across different geos’.
Header Bidding Wrappers Adoption
As per Kevel header didding statistics,72% of header bidding solutions are built on top of Prebid. Whereas, 28% of wrapper solutions are proprietary.
What about server-side header bidding? Or hybrid header bidding?
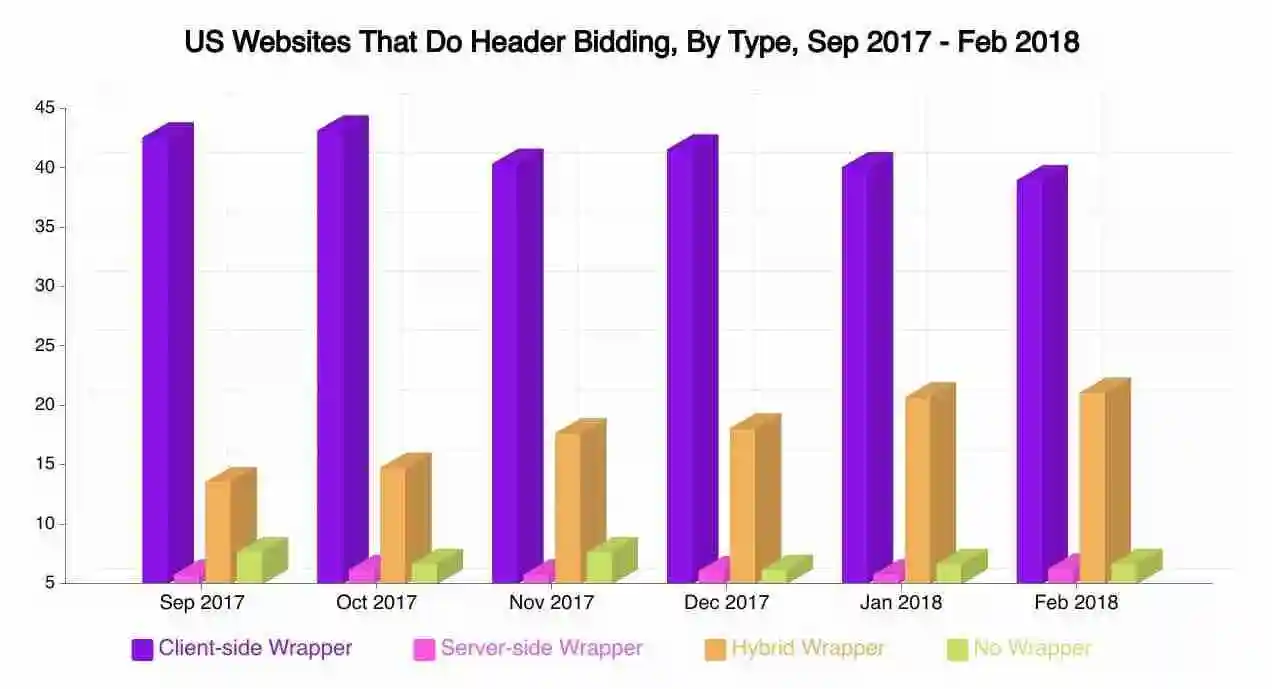
Although client-side header bidding may cause latency issues, 39% of publishers did client-side header bidding while just 6.3% of publishers used the server-side technique to sell the ad inventories in 2018. And there were 21.1% of total publishers with header bidding sites implemented hybrid to take benefits of both, rather than depending on just one (Src).
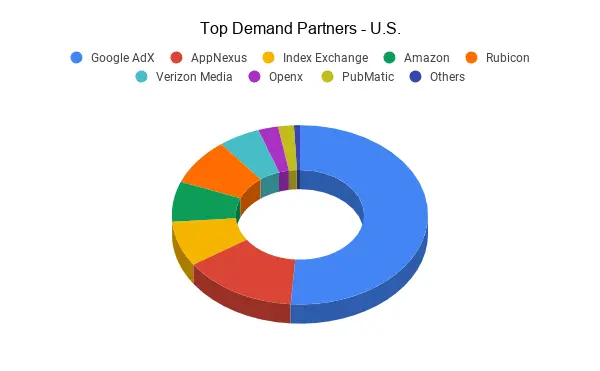
Header Bidding Demand Partners
But, what are the demand partners that are driving growth in header bidding?
Based on our study, after Google Ad Exchange, AppNexus’ wrapper is used by the majority of publishers whereas Index Exchange and Amazon occupied third and fourth place in the top US demand partner list in Q1, 2021. Read more about the top demand partners in different geos’ here.
Header Bidding Adapter
In January 2018, 27% of publishers had 6-8 adapters integrated into the page. And nearly, 13.5% had more than 9 adapters to their site (Src). Here’s the graph showing the top ten adapters used by the publishers in 2021:
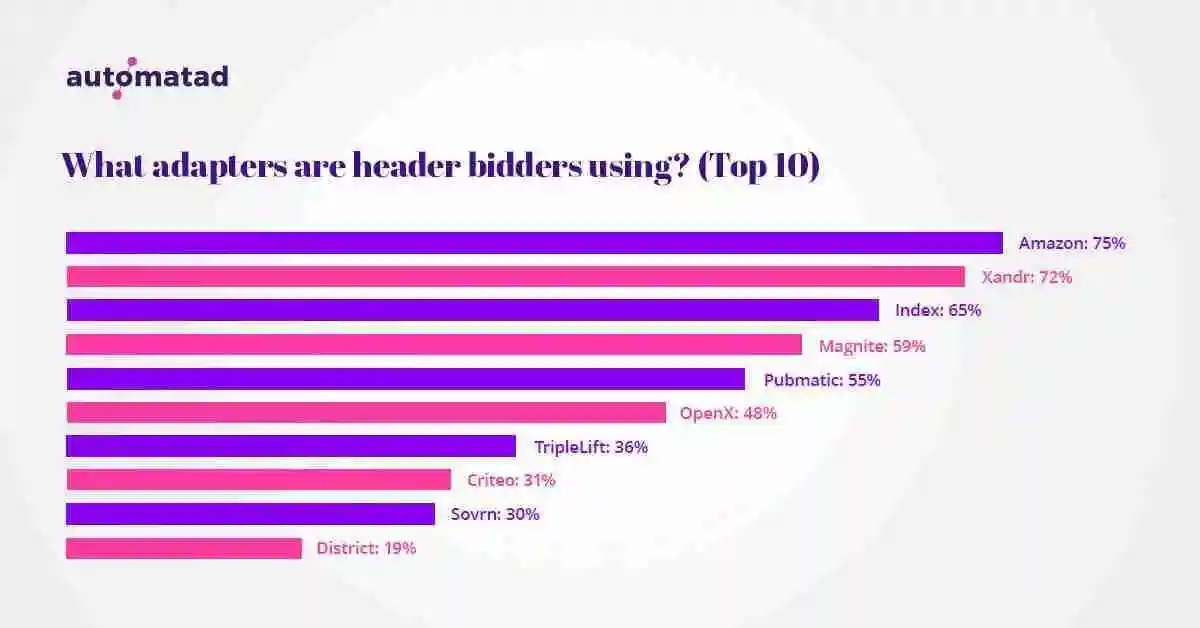
Source: Kevel
Since it is pretty clear that header bidding is common on desktop and mobile devices, it still needs time to grow and to gain popularity as a solution for in-app monetization. Let’s look at the numbers and what restricts the app publishers to utilize the technique.
In-app Header Bidding
Here’s the pain point:
31% of publishers did not implement header bidding due to limited understanding of the technique and almost 23% of the total avoided it because of the technical implementation issues by 2018 (Src). But, the recent study by PubMatic showed a spike in in-app header bidding adoption due to the introduction of new SDK-based technologies.
Also, the majority of tier 1 publishers such as Vogue and Tech Crunch have their in-house built mobile applications, and 38% of them agreed on reducing latency and 37% said that transparency is better than waterfall.
Conclusion
In particular, the rise of header bidding has completely changed the programmatic landscape. And yes, we aren’t denying that header bidding causes page speed latency. But it can be reduced by setting up the auction environment optimally. For example, an ideal number of having demand partners is 5 – 7 or taking proactive approaches in calling the demand partners. Besides, you can take the help of programmatic experts to optimize the header bidding set-up at any time.
Now that you looked into the Header Bidding Statistics and know how header bidding is growing and expected to grow more in the future, let’s know in the comments if you have any questions on the bidding technique or need help with setting it up on your website. We’re just a click away.