
Google Analytics is quite popular and is widely used by publishers to track users and observe their behavior as they interact with web pages. By being able to track user behavior on your website, you can optimize key areas such as your ad performance, and improve monetization capabilities. You can also make predictions based on existing trends to optimize your ad inventories.
While the Google Analytics interface might look simple, it has many nitty-gritty features that many publishers are unaware of. Regardless, some easy-to-understand reports should be prioritized to help you improve your revenue considerably. With this article, we will provide you a look at what these are, and the insights you can draw from them.
Table of Contents
Google Analytics Reports Publishers Should Prioritize
1. Landing Pages
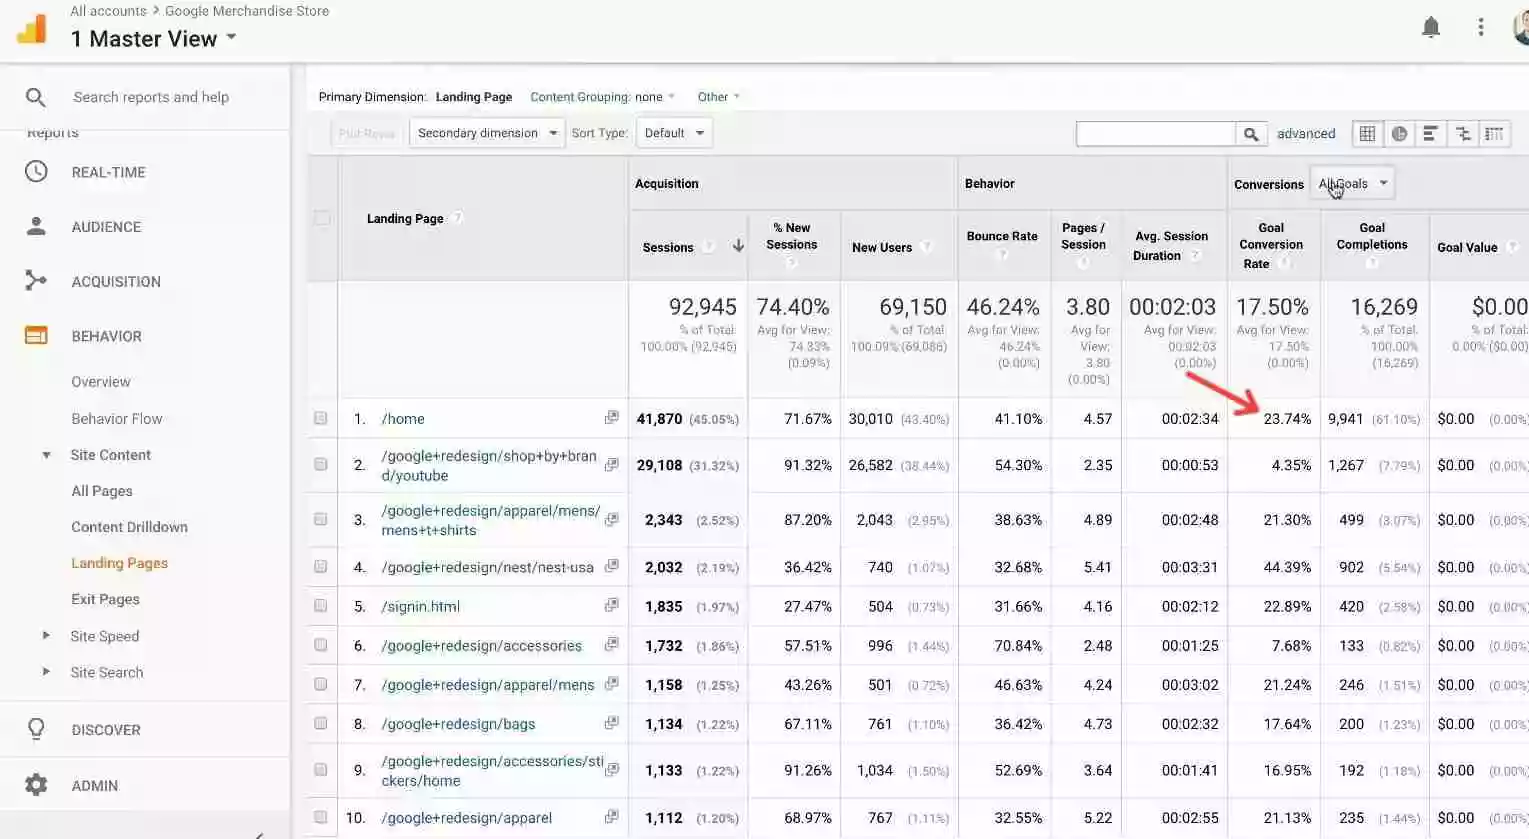
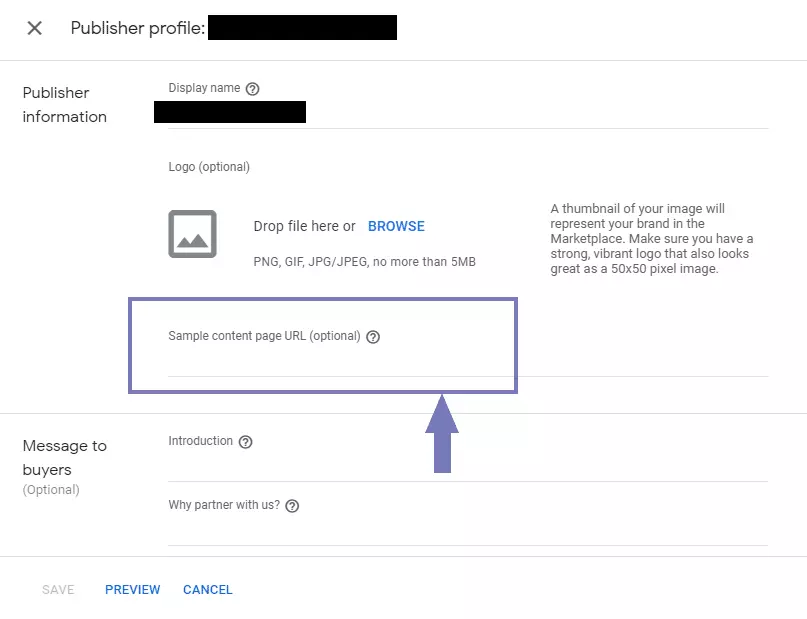
You can access the report by clicking on Reports > Behavior > Site Content > Landing Pages. Use it to figure out what the top pages in your website are and include the same in your Publisher’s Profile in Ad Manager. You can do it by logging into your Google Ad Manager, and navigating to Sales > Deals Settings > Publisher Profiles > New Profile > Save after editing.
Your Ad Manager’s Publisher Profile is important since it allows advertisers to view your network’s inventory in the marketplace. Having top pages that directly incline with the preferences and campaigns of advertisers ensures a greater chance of you bagging Programmatic Guaranteed, Private Auction Deals, and Preferred Deals.
2. In-Market Segments
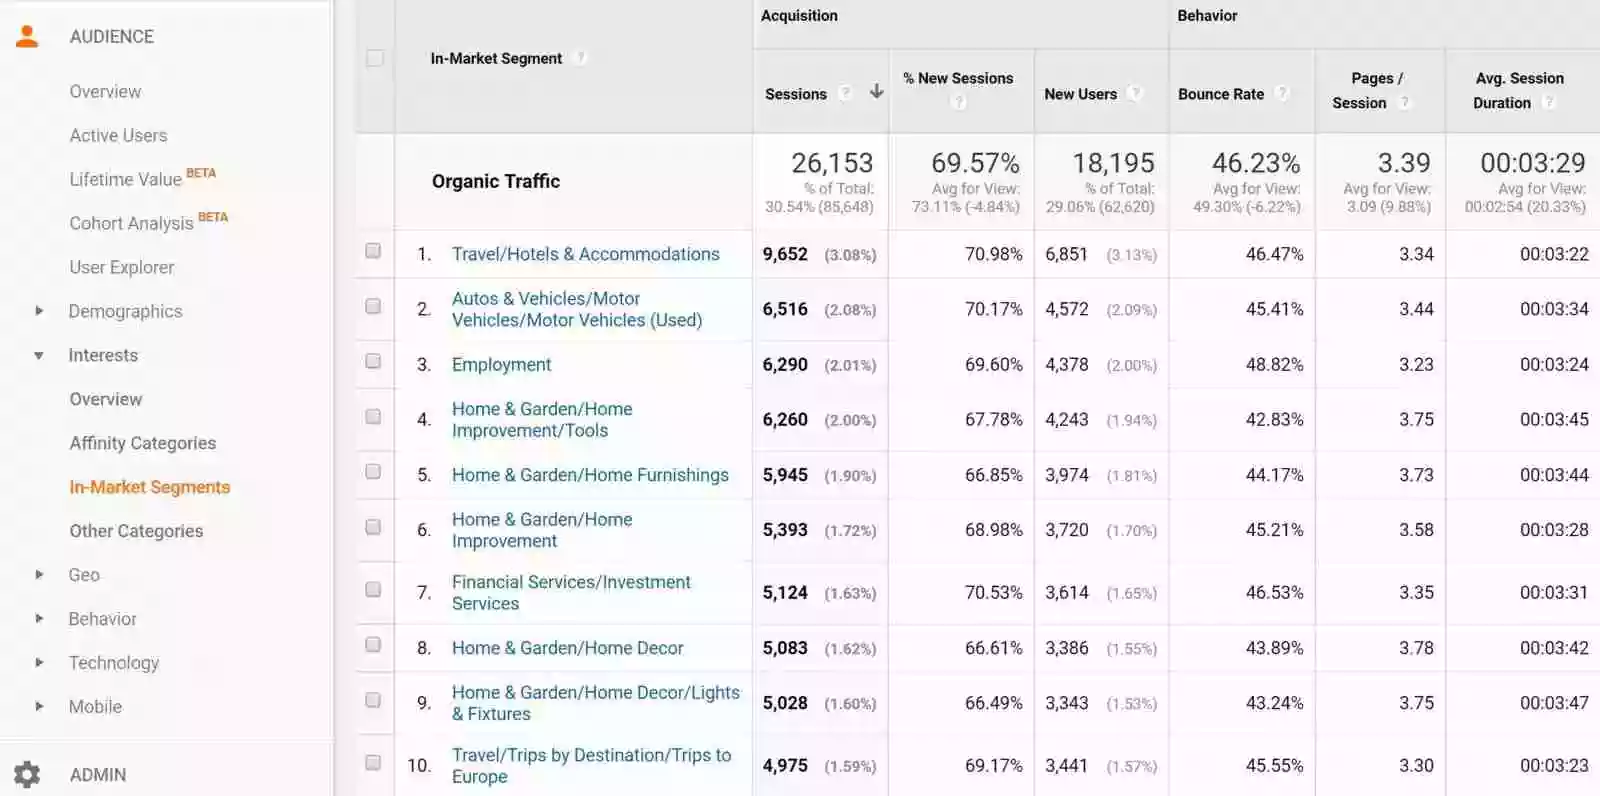
You can access the report by clicking on Reports > Audience > Interests > In-Market Segments. This dimension in Google Analytics lets you know about users who are most likely to purchase products belonging to a certain category. It gives you an idea of users who are actively searching for these products online. These users are grouped based on their recent shopping behavior. By looking at it, you will get an idea of what the active interests of your website audience are, in real-time.
For example, if someone is searching for kitchen appliances, Google groups them under that category. Hence, if you see a majority of your users searching for a particular product type on your website, you can approach advertisers selling similar products and set up programmatic direct or guaranteed deals with them.
3. Affinity Categories
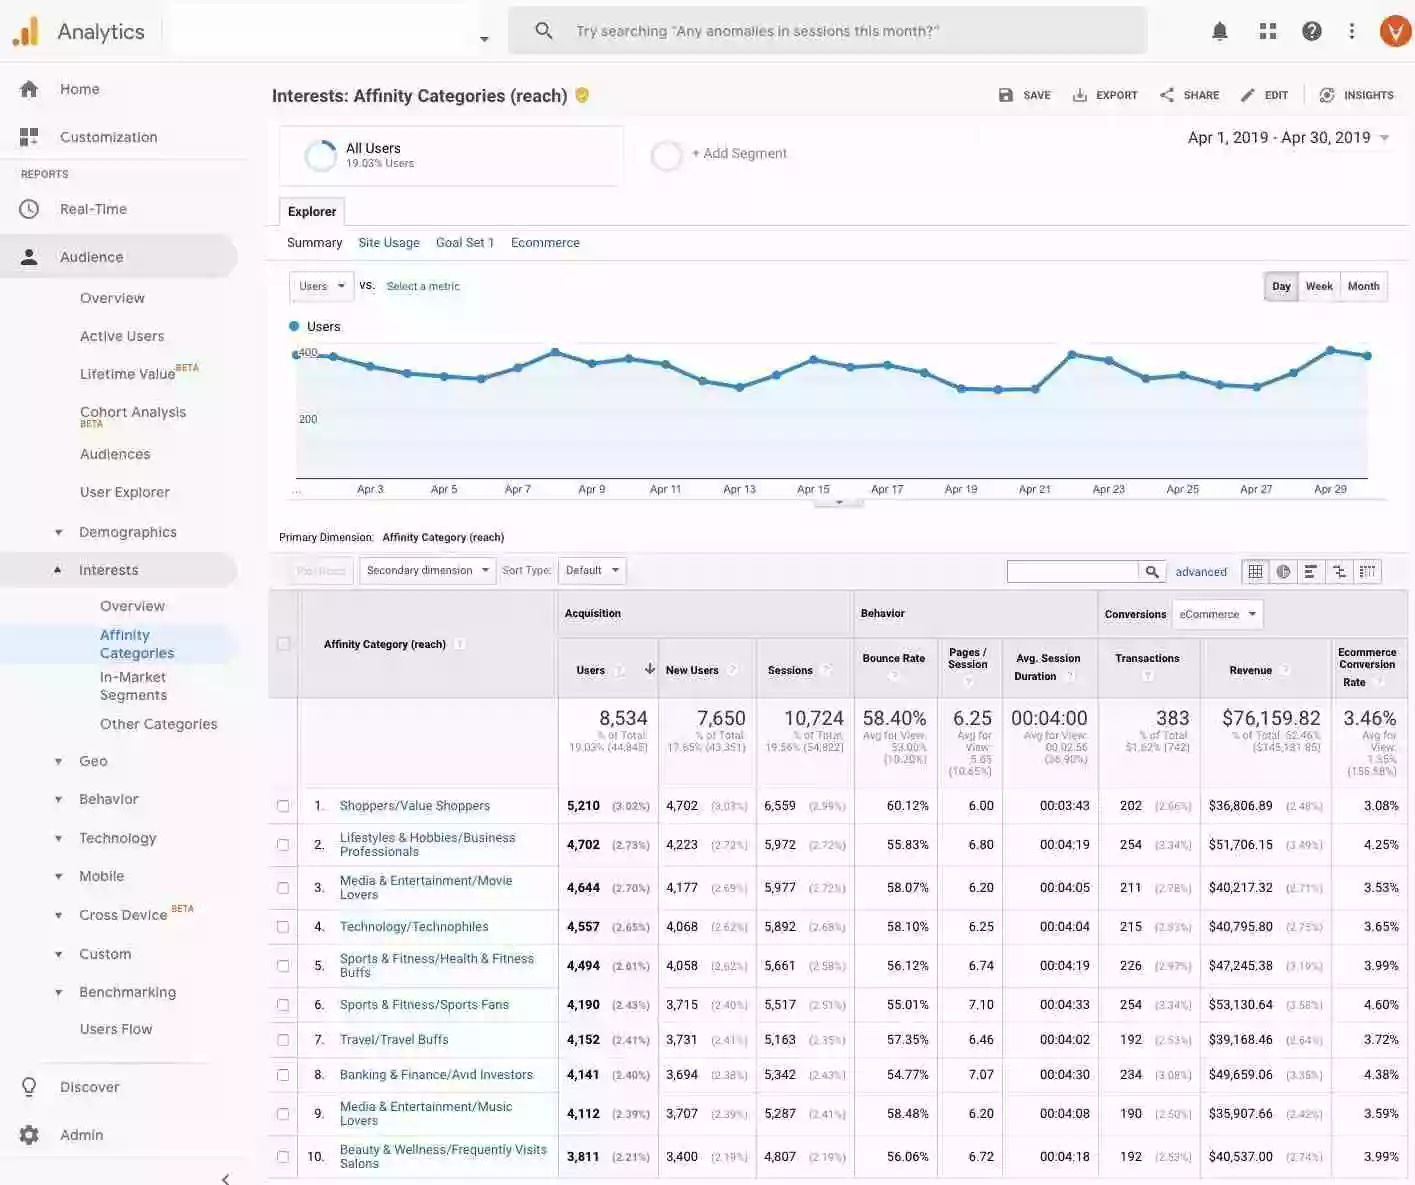
You can access Affinity Categories by clicking on Reports > Audience > Interests > Affinity Categories. The report’s information gives you a clearer idea of what the likes and interests of your users are. Having been collected over a considerable period of time, they are fairly accurate. You can use the report in the following ways:
- Creating an audience plan by narrowing down the interests of your audience. User interest is extremely important while evaluating the effectiveness of an online ad. The more aligned an ad is with user interests, the more CTR it is bound to accrue. As Affinity Categories gives you an elaborate insight into the preferences and interests of your users, you can use it to better target them with relevant ads.
- Find out the interest categories that are resulting in the highest conversion rates for your website. By drilling down into each affinity category, you can further find out which age group or gender (by further drilling down into an age group) within that interest category is bringing in the most revenue.
- Use this report to create content for your website that might not coincide with the niche that your website deals with. If you notice that some of your users are interested in topics similar to the type of content that you produce, you can cater to those users by creating blog posts or articles. The blog posts and articles should be inclined with the interests and preferences of these users while staying true to your regular content’s topics.
For example, you might have an eCommerce website that focuses on kayaking gear and you find out that a large volume of users visiting your website are interested in traveling. You can create blog content or even offers that target the idea of traveling. A great idea for a blog post might be “10 Great Travel Destinations For Kayaking”, thereby allowing you to combine your specific niche with the interests of most visitors to your website.
4. Mobile Reports
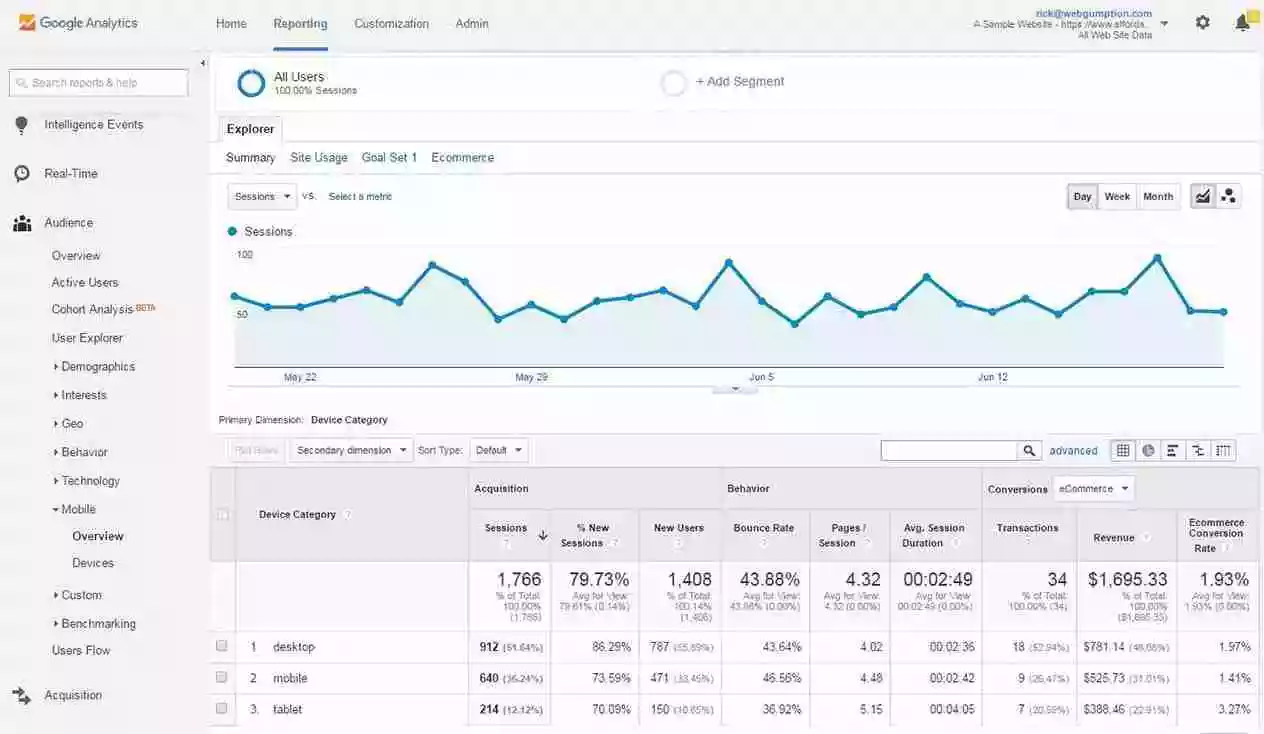
You can access the report by clicking on Reports > Audience > Mobile > Overview, or Reports > Audience > Mobile > Devices. You can further deduce the following:
- Associate revenue accrued with individual device types. Note that it is only for publishers who have eCommerce stores activated on their website. You also need to have the e-commerce tracking feature activated.
- It also allows you to segregate your website’s traffic between mobile users, tablet users, and desktop users. Advertisers are more inclined to pay higher for reaching desktop users as compared to mobile users, although the trend is changing.
You need to understand that every pageview is still valuable as it keeps earning for you, despite the price it might demand. Analyze if you have a higher demand from mobile-specific users. If so, choosing an SSP that is dedicated to providing mobile monetization services would be advisable.
5. Search Terms
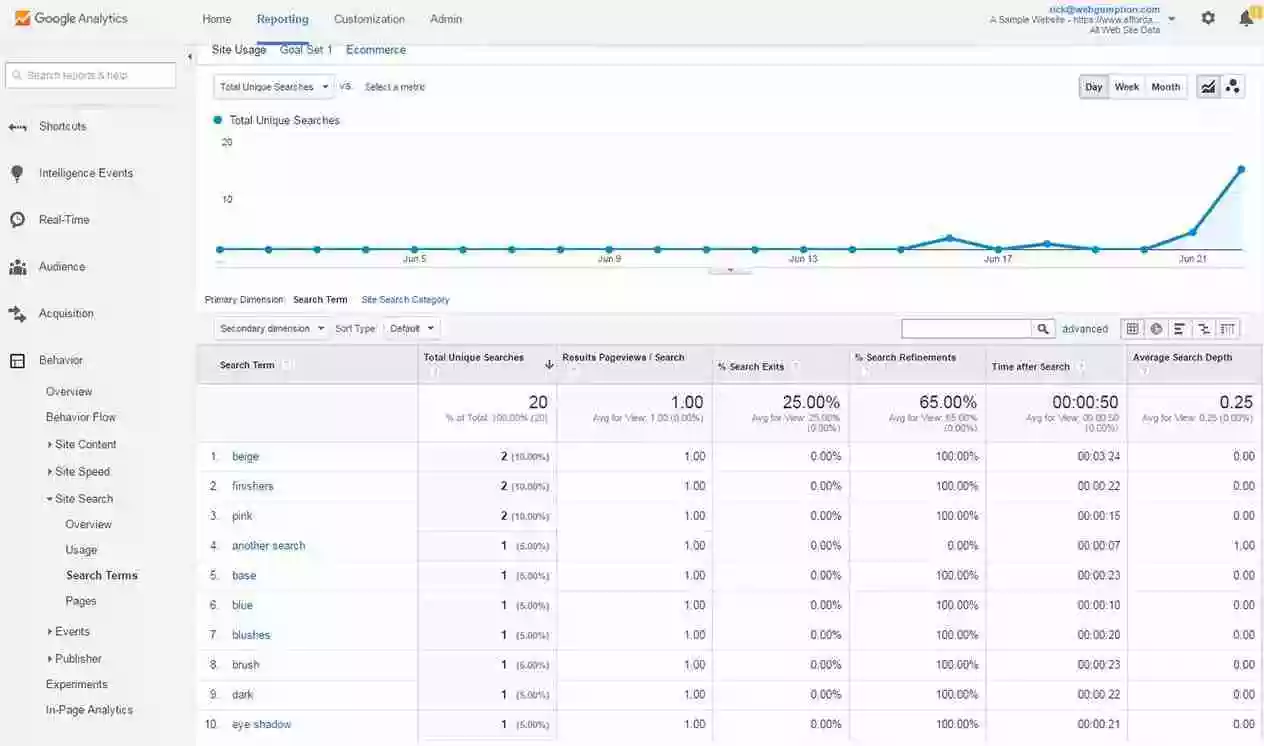
You can find it by clicking on Reports > Behavior > Site Search > Search Terms. Search Terms are extremely useful because it allows you to understand what your users are searching for on your website. Ensure that your Site Search is activated for the report to work. You can do it by following the steps provided here. Use this report to:
- Identify whether you have adequate content corresponding with the actual search terms that your users are searching for. If not, it means that you have a content gap existing on your website, which you can improve upon by creating content that corresponds to the search terms.
- Search terms can be anything from keywords, to entire queries and phrases. These are terms that users have searched for on your website. If you see that a certain page is amongst the highest ranked searches, it indicates that the content on that page is immensely popular, and repromoting it might be a good idea. If it happens to be an outdated page, still ranking high, maybe you should consider refurbishing the content.
- You can also find better terms for your products (in case you are running an eCommerce website). You might be defining your products in a certain way using certain keywords. However, the report might indicate that users are actually searching for the same using different keywords. It would be wise to change how you have been defining them.
6. Location
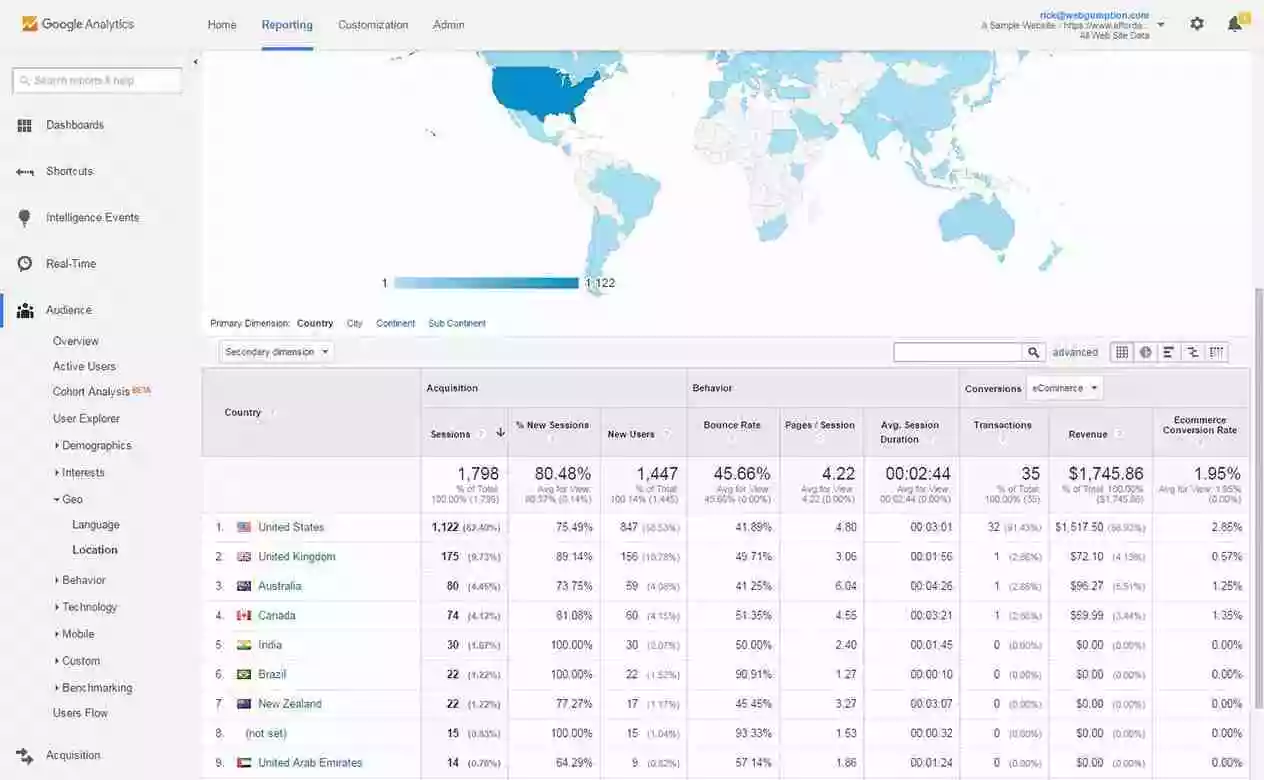
You can access it by clicking on Reports > Audience > Geo > Location. Your location report can be utilized to gain the following information:
- Identify countries that are resulting in high traffic to your website.
- Once identified, you can create individual campaigns for these countries and boost your ad revenue performance.
- Attract local advertisers who prefer to target users from a particular region compared to an international audience and set up direct deals.
7. Top Events
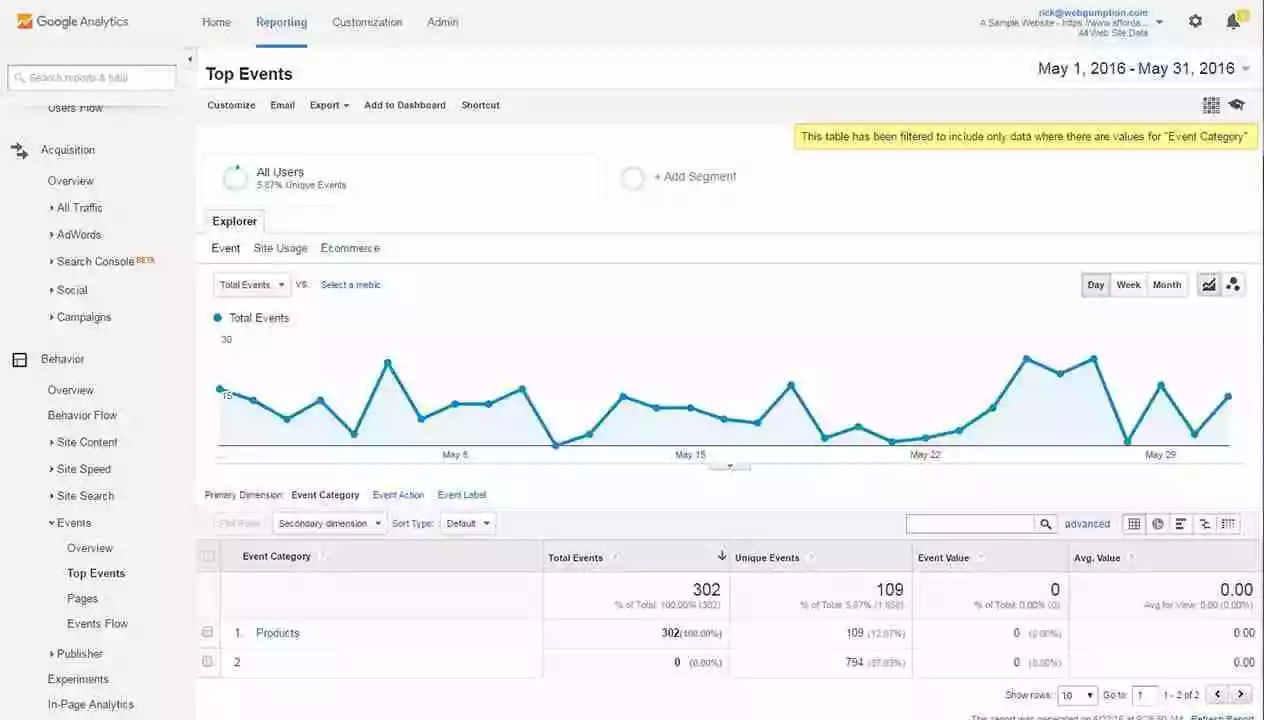
You can find the report by clicking on Reports > Behavior > Events > Top Events. It can be used in a variety of ways depending upon the metric or activity that you wish to monitor based on your specific needs. Use the report in the following manner:
- By determining top events, you can add value to specific actions. The actions might include monitoring how many times someone has seen your video, or how many times someone has clicked on an ad, or signed up to newsletters. The options are endless.
It will enable you to better understand the activities that users partake in most frequently after visiting your website.
8. Goals
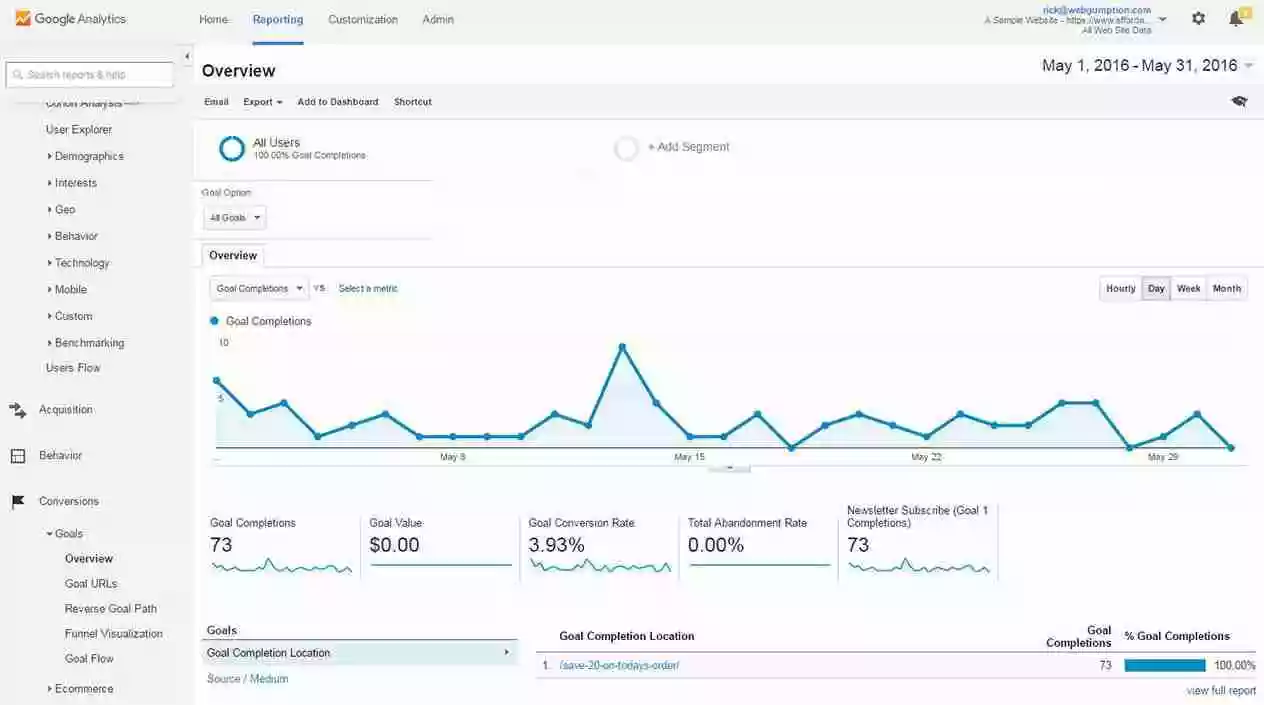
Every website serves a specific purpose. It might be to encourage purchases of products (for eCommerce websites) or getting an account registered (for a website with freewall). Based on the specific needs of your publishing business, these goals will differ.
The goals report in Google Analytics lets you track these aforementioned activities, enabling you to track the success of your online business. You can access the report by clicking on Reports > Conversions > Goals > Overview. Some important goals include:
- Destination goals are triggered when a user visits a particular page or various pages in a pre-set order. These can include signing up for a newsletter and going to the “Thank your subscription” page right after that.
- Engagement goals such as session duration goal and pages per session goal, which have been predefined by you.
- Event goals such as clicks on ads which you can then compare with each other to select the setup that works best for you.
Make sure that these goals have been predefined by you, in accordance with your business’s requirements. By evaluating your goals report:
- You can assess the success of your online business.
- Improve upon areas by implementing strategies that might contribute to the success of a particular goal.
9. Publisher Report

Google Analytics is used to track user behavior, while Ad Manager allows you to serve ads on your websites. How user behavior impacts ad revenue and how ads have an influence on user behavior is an area that can be understood by integrating the two platforms. With Publisher Reporting, this shortcoming is addressed. You can view both Ad Manager performance and website performance using a singular integrated report on the GA UI. You can find it by navigating to Reports > Behavior > Publisher.
Please note that it is available only for the Analytics 360 account (the paid version of Google Analytics) and you also need to have an Ad Manager 360 account. The information you can derive from the report includes:
- Combined reports that show impressions, revenue, and clicks from Ad Manager broken down with reference to specific pages or traffic sources.
- Find out the pages and domains that contributed to the most impressions on Ad Manager.
What’s Next?
The opportunities that you have using GA reports are practically limitless. From checking your top landing pages to improving revenue per session, analyzing the data provided by GA reports can enable you to make the best business decisions.
Therefore, it’s important to prioritize familiarizing yourself with this analytics platform. After all, in today’s ecosystem, both data and analytics are crucial for achieving content monetization success. Hopefully, our article has better acquainted you with the various reports in Google Analytics. If you have any questions, we encourage you to leave a comment and we’d be happy to answer.