
As a publisher, you are under pressure to provide better user experience and maximize yield as well. But it isn’t complex as you think. Understanding your demand partners can definitely make a big difference in the success of your ad campaigns and the site’s user experience. The better you understand your bidders, the better you can optimize your header bidding set-up. This, in turn, maximizes your revenue and helps you deliver the ideal user experience.
That’s where header bidding analytics tools come in. They provide you in-depth analysis of the demand partners, performance, and also impact of content on your bottom line. But, before diving deep into the best analytics tools, let’s have an overview of what they can offer you and how you can use it.
Table of Contents
Benefits of Header Bidding Analytics
A huge number of publishers have implemented header bidding on their site – either via an open-source framework like Prebid.js or via a header bidding provider. Whatever the case is, an analytics tool can deliver the most valuable insights to the publishers to help them make the right decisions regarding the current ad stack, content, ad campaigns, and more.
Here’s a quick overview of what you can get with the help of a header bidding analytics tool.
What are the Benefits of Header Bidding Analytics?
- Analyze Demand Partners: You can collect actionable bidders’ data with the help of the analytics tool.
Raw figures can only provide you insights into a part of the bidding strategy but you need more than that to make decisions. You can detect anomalies and analyze the performance of bidders by looking into the metrics including timeouts, bid load time, eCPM, win rate, and more.
- Better Your Content Strategy: Analytics tools can help you understand your content distribution strategy. Understanding the pages that are driving the most revenue and engagement should be considered while planning content campaigns.
The analytics tool can track the pages enabling you to compare what content is performing well for you. Of course, you can connect your Google Ad Manager and Google Analytics to do the same.
- Get Insights into GAM: If you have set up line items in Google Ad Manager for header bidding, then the tool can also provide a combined view of the performance of GAM advertisers, line items, and orders without signing in to the server’s dashboard.
Note that not all the analytics tools can provide it, but some do.
- Know Your Best Referrals: Analytics tools can help you understand which referral source has contributed to the maximum impressions and revenue.
Being able to understand which referral source has contributed to the maximum impressions and revenue is important. It allows publishers to make informed decisions on marketing strategy and content allocation on the referral channels. For instance, if users from Facebook tend to contribute more revenue than the users from Twitter, you can see how to improve reach and CTR on Facebook and spend more time optimizing Facebook campaigns.
What are the Best Header Bidding Analytics Tools?
Here are some of the well-known header bidding analytics tools in the market today.
- OpenX
- PulsePoint
- Rubicon Project
- Assertive Yield
- ShareThrough
By now, you have an idea of how analytics tools can help you monitor the header bidding setup, drive better revenue and user experience. With myriads of analytics tools available in the market, selecting the right one can sometimes be tricky.
As we said earlier, there are several great tools out there – paid and free. In this piece, we are trying to list some of them to help you get started. You can use them if you are using Prebid.js for implementing header bidding.
OpenX
Being an SSP and ad exchange, OpenX provides a header bidding analytics tool for publishers to deal with the complexities of header bidding. The tool has three different sections – Analyze, Pivot, and Plot that enable publishers to organize and customize the data based on their requirements. It has a wide range of features that publishers can tailor to their needs.
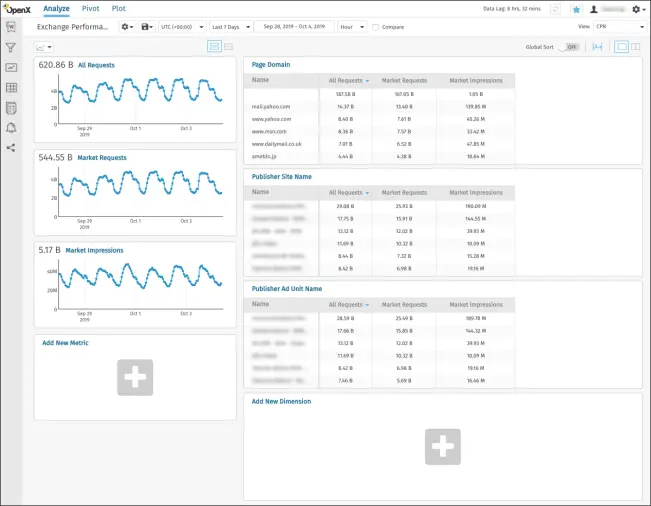
- It provides an overview of how many impressions and revenue were contributed by a particular ad unit, ad placement, page, etc. The report can display the number of ad requests, revenue, and impressions based on several dimensions such as page domains, ad units, brand name, ad size, user’s geography, operating system, and more.
- The Bid Performance section evaluates the bids’ activity based on demand partners, channels (i.e. private marketplace deals, open auctions, etc.). You can check metrics like Bid requests, eCPM, fill rate, PMP impressions, Opportunities, Win rate, and many more.
- It also provides a custom-value report that shows an overview of impressions, revenue, CPM, and other metrics based on dimensions – Key values, Custom key, Inventory site ID, etc.
PulsePoint
PulsePoint has helped many publishers understand their bidders and header bidding setup via the analytics tool. The dashboard displays four types of reports – Daily publisher report, Account management report, Category report, and Video monetization report. So, if you’re using Prebid.js wrapper, then you can take advantage of the following functionalities of PulsePoint with the help of the API provided by the vendor.
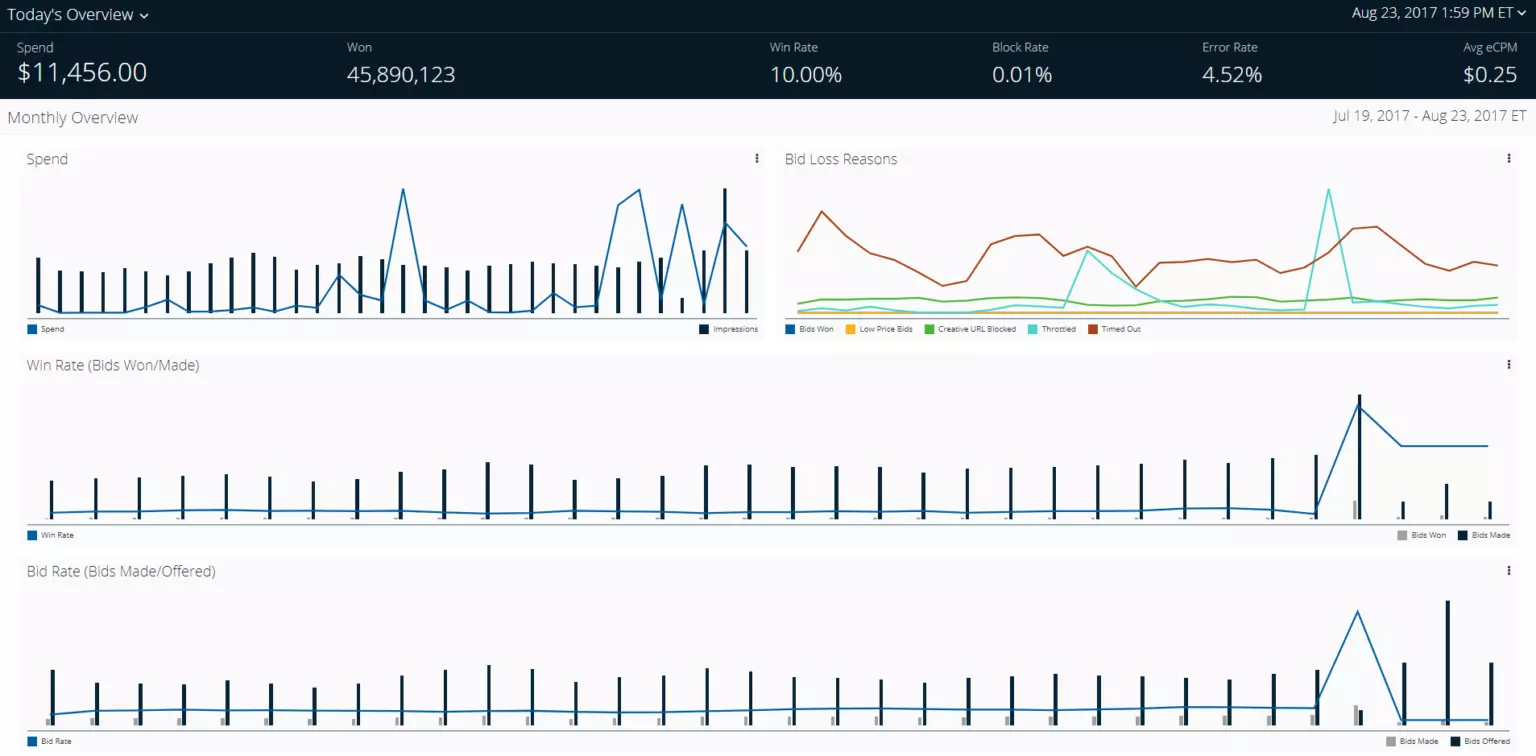
- Daily publisher report – Publishers can check the key metrics such as average CPM, paid and passback impressions, fill rate and net revenue on a daily basis. The vendor provides an additional feature of “Throttle Settings” that enables publishers to put a limit on the number of requests so that the database doesn’t get overwhelmed.
- Account management report – The report displays the revenue generated by the bidders during a specified time period. It can be filtered out by ad tag IDs, ad tag names, ad sizes, demand channels, etc. Also, the report can show the status of your ad units (active or inactive) in the dashboard itself.
- Category report – PulsePoint offers the report to enable publishers to know about their header bidding wrapper by breaking down the data into contextual categories. For example, you can check the total impressions and revenue generated by a bidder for the Art and Entertainment category.
- Video monetization report – As the name suggests, the report shows how your video demand partners are doing. You can check the total impressions, click-through-rate, and many other metrics. The report can be broken down into several fields such as video ad tags, ad tag type, fill rate, etc.
Rubicon Project
In the programmatic advertising industry, Rubicon Project offers one of the best proprietary and interactive analytics for publishers. The robust reports provide valuable ways to discover the best bidders and optimize your strategy with the help of data.
Here’s a list of insights you can get from the tool:
- The analytics tool displays the performance of multiple mediums (display, video, mobile, native) in terms of metrics – impressions, revenue, eCPM, etc. It helps publishers to identify new opportunities and increases optimization.
- Understand the net revenue, impressions, and eCPM from different bidders. You can break down the report to find out how your sellers value different users based on geography, etc., and how they affect page load time and many more.
- Besides, you can also build reports and track campaign delivery, sales performance, programmatic revenue. Analyze the report to understand the programmatic market changes and find an optimal match for SSPs.
Assertive Yield
Assertive Yield’s optimization platform offers a free analytics tool for publishers with less than 10 million monthly impressions. You can get actionable data and insights to create custom reports and analyze how the wrapper is performing. At the basic level, you can view the total ad impressions, prebid won revenue, win rate, and more.
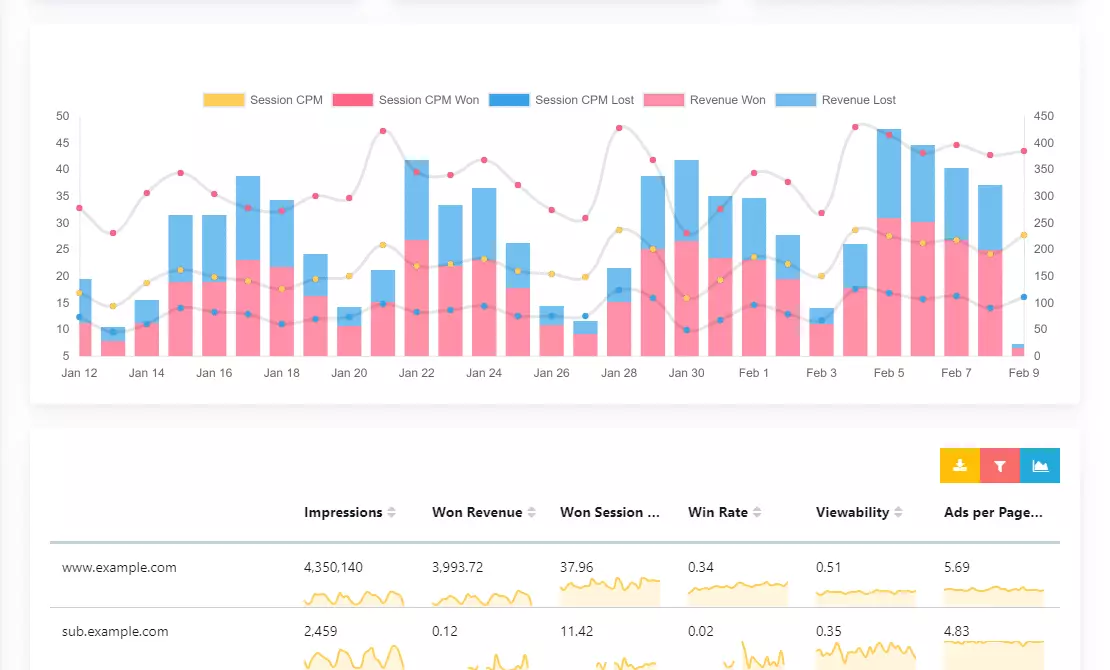
Besides, you can get the following insights:
- Demand partners report: This section enables publishers to analyze the winning and highest bidder and how time they took, demand-side platforms, buyer, brand, bid, deal and media type, and many more.
- Google Ad Manager report: The dashboard can show how the advertisers, line items, and orders have been performing for a time period. You need not have to sign-in to the GAM dashboard and analyze data there.
- User report: Assertive Yield analytics tool can let you know how a specific segment of users is doing. You can check impressions, revenue, eCPM, etc. based on devices, operating systems, regions or countries, languages, etc.
- Referral source report: Check the referral sources report to analyze the impressions or revenue contributed by them. You can also check the UTM source, domain, content, and more.
ShareThrough
The analytics tool offered by ShareThrough allows a publisher to analyze relevant data and draw conclusions. You can monitor prebid wrapper data with transparent analytics and compare the wrappers with the previous and current setup. ShareThrough’s tool uses AI-based and machine algorithms to gather the numbers (impressions, revenue, etc.) and provide accurate results.
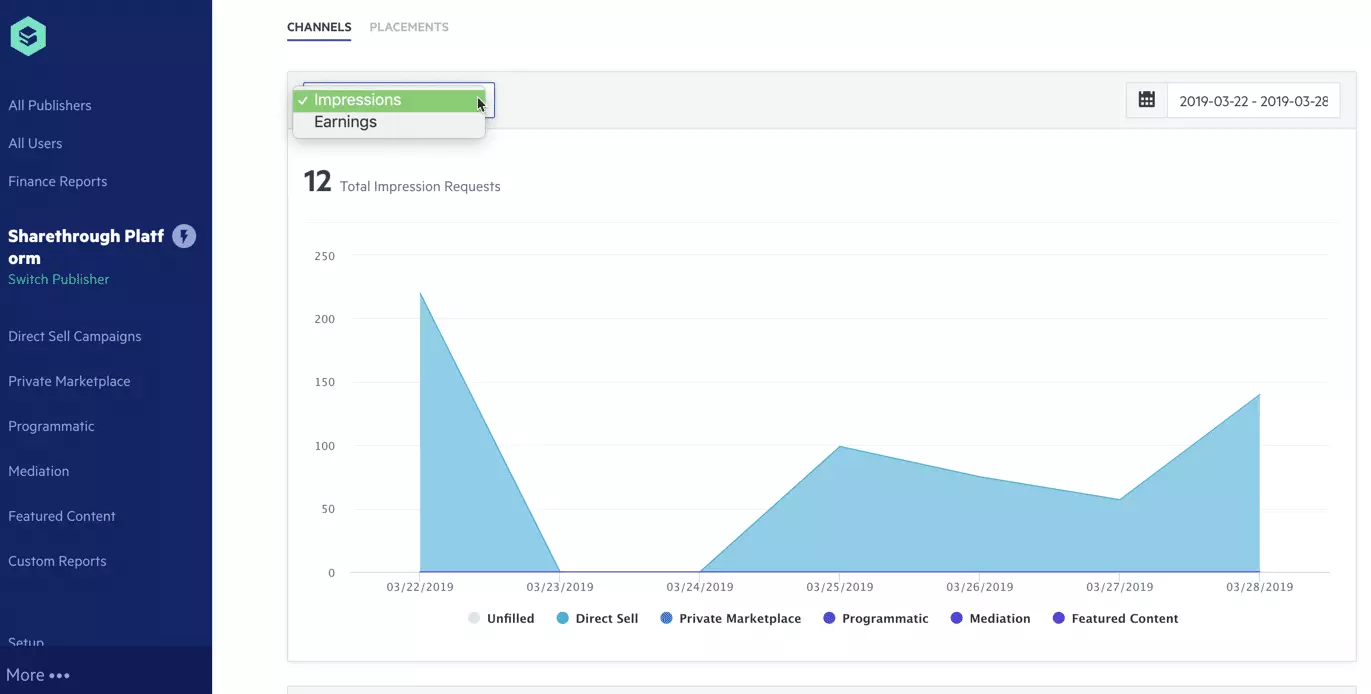
- The tool allows publishers to view various metrics such as impression requests, fill rate, engagement rate, earnings, etc. You can select a custom date to observe how bidders are performing.
- Like other analytics tools, ShareThrough also provides granular metrics to understand performance with respect to the page’s context, domain name, location, etc. This enables you to understand the top-performing content and optimize other web pages accordingly. For video content, the tool displays the percentage of completion helping publishers to know the engagement rate.
- You can check how the ad units, creatives, ad sizes, etc. are doing and the “Top Creatives” tab displays some of the best performing creatives in a row.
What we have mentioned here is some of the header bidding analytics vendors in the market for prebid.js wrapper. However, if you’re partnering with a header bidding solution provider, then chances are pretty high that they will offer you a free analytics tool. In such a scenario, from the integration to the data import and export is done by them, minimizing the need for the assistance of any professional data scientists to glean data and insights.
For instance, at Automatad, we provide publisher a comprehensive analytics tool to help them understand the performance of bidder partners, best referrals, best performing content (in terms of impression/revenue), DSPs and brands bidding for the impressions, and more.
What’s Next?
Go deeper and check each bidder’s performance, breaking down them by geography, device type, content type, etc. Keep monitoring the CPM, bid load time, timeouts, and other major metrics of all demand partners in your HB landscape. Then, run experiments and give it at least a week before reflecting on the results.
Though we tried to include some of the best header bidding analytics tools in the market, there are many more vendors that can gauge and analyze your wrapper. But, look for the analytic capabilities, integration, visualization, data import and export, and scalability before settling on a vendor. Didn’t find what you’re looking for here? Let us know in the comments.