Being a publisher, you may have used Google Ad Manager to serve and manage ads. But, you may haven’t realized that Ad Manager has much more to offer, especially in improving the quality and performance of the ads.
Although the Google Reporting feature will show you how various networks, SSPs, etc., are performing, it won’t help solve various ad delivery issues. In this article, we’ll introduce one of the features of Google Ad Manager, known as Google Publisher Console, that you can take advantage of to troubleshoot DFP ad delivery.
So, let’s start from the basics and understand what Google Publisher Console is and how you can use this to troubleshoot ad delivery.
Table of Contents
What Is Google Publisher Console?
Google Publisher Console is a Google Ad Manager feature that enables publishers or developers access to special features that help analyze and diagnose the ad delivery issues in the ad server. As a debugging tool, Publisher Console helps publishers find if the line items are returning ads properly or if there are any JavaScript-related tagging errors.
However, to get access to the Console, a publisher should have added Google Publisher Tags (GPT) to the web pages where ads will be displayed. So, if you haven’t generated and added GPT to your web pages, look at this article.
How to Enable Google Publisher Console in Google Ad Manager?
Now that you’ve added GPT to your web pages enabling Google Publisher Console is time. To enable Google Publisher Console, follow one of the three methods described below.
Bookmark Method
By creating a bookmark in your browser, you can enable Publisher Console. Below are the steps to create and enable the Google Publisher Console for troubleshooting.
Step 1: Open the browser (Chrome or Mozilla). Click the More icon present on the top right side of the browser.
Step 2: Go to Bookmarks > Bookmark Manager. Click the More icon present on the top. And then add a new bookmark.
Step 3: Enter a name for the bookmark, e.g., Publisher console, and write “javascript: googletag.openConsole()” in the URL field. And Save.
Step 4: Go to your website and click on the newly created bookmark. This will open the Google Publisher Console at the bottom of the webpage.
Console Method
This method requires you to use the browser console and enter “javascript: googletag.openConsole()”. Since every browser has a different method to access the console, you have to check how to enter the javascript code for your browser. Follow the steps below to open the Chrome console and enter the JavaScript code.
- Click on the More icon on the top of the right side of the browser.
- Then, go to More Tools> Developer tools. This will open the Console by default.
Note: Ensure the page (where ads are displayed) is already opened in the present tab before enabling the Chrome Console.
URL Method
- Go to the website where ads are displayed using Google Publisher Tags.
- Add the string “?google_console” or “?googlefc” to the website’s URL. And click Enter.
Once you execute the steps mentioned above, Google Publisher Console will open at the bottom of the page.
Using Google Publisher Console to Troubleshoot Ad Delivery
Google Publisher Console has two primary tabs – the first tab displays page information, i.e., “Ad Slots” and “Page Requests,” and the second tab (i.e., setting icon) shows GPT and Console versions (pictured below).
Also, an option “Open in Delivery Tools” opens the Ad Manager account in a new tab to analyze and troubleshoot ad delivery issues. So, let’s discuss some of the important specifics of the Console.
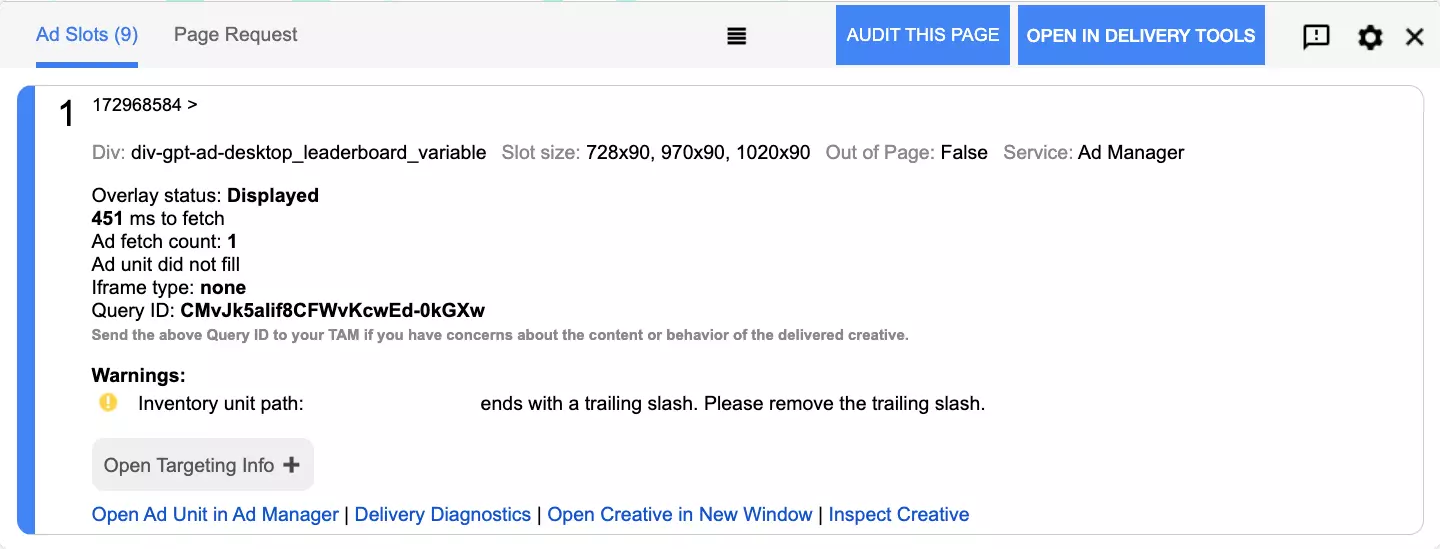
Ad Slots:
Ad Slots represent the number of ad slots present on a web page and various information related to them i.e.
- Publisher ID,
- Ad unit size,
- Time to fetch and render the ad creative and Ad fetch count,
- Iframe type, e.g., SafeFrame, FriendlyIframe, etc. These Iframe types embed the ads within the frame so the ad doesn’t interfere with the surrounding.
- Query ID generated by Google. Google assigns the Query ID to each ad slot which helps publishers to find line item details associated with the respective slot.
- Links to diagnose and debug line items in Google Ad Manager – Open Ad Unit in Ad Manager, Delivery Diagnostics, and Open Creative in New Window.
Page Request:
Page Request tab displays:
- Publisher’s URL,
- Current Browser Version,
- Total time to fetch and render the ads, and
- A timeline that shows the complete process of ad fetching and rendering on the page.
You can see a drop-down menu, i.e., “Reload Page.” With this menu, you can reload the page in three different ways:
- Normally – It will request and render ads.
- Without ads – It is the opposite case of “Normally” page loading. Selecting this option won’t request and render ads.
- Without rendering ads – This will request but not render ads on the page.
Google Publisher Console enables a publisher to infer information related to ad delivery. You can determine if the ads are served via dynamic allocation or direct deals. All you have to do is to enable the Console and click on the ads.
Note: If you see an error “Ad unit failed to fetch,” it may happen due to exceeding the character limit in the ad request URL. Based on the ad tag type, ad request URLs have a fixed number of characters that shouldn’t be exceeded.
The ad request gets truncated if the count increases, and the Google Publisher Console displays the error. Or sometimes, it may happen due to other reasons, e.g., unavailability of eligible line items to deliver ads, GPT not working properly, or malfunctioning of ad codes.
Enable Google Publisher Console via Google Ad Manager
Although the methods mentioned above to enable Publisher Console work, you can do it by Google Ad Manager. To do so, follow the steps given below:
- Sign in to your Google Ad Manager account and go to Delivery tools in the left side panel.
- Here, you can choose one option: Webpage ads, Mobile web ads, Mobile app ads, or In-stream video ads.
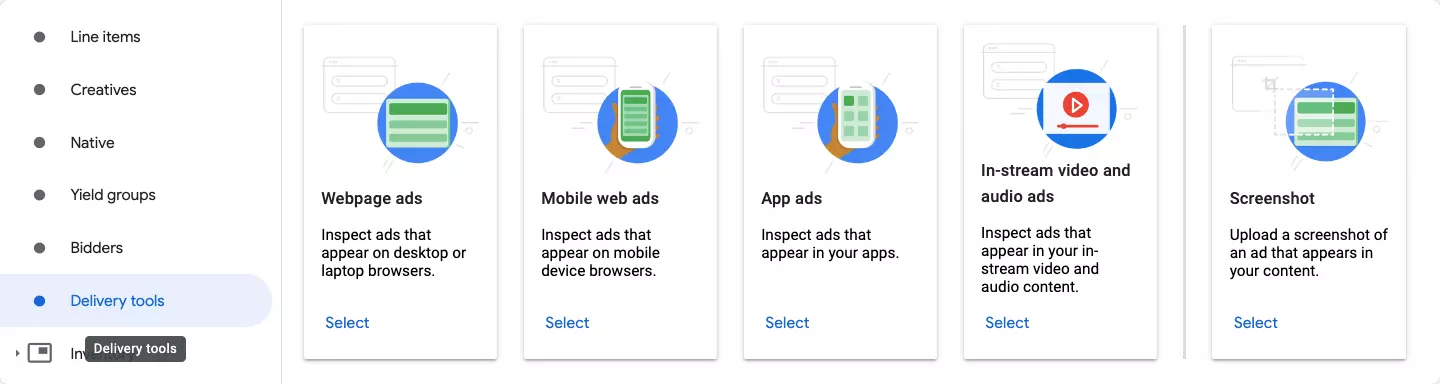
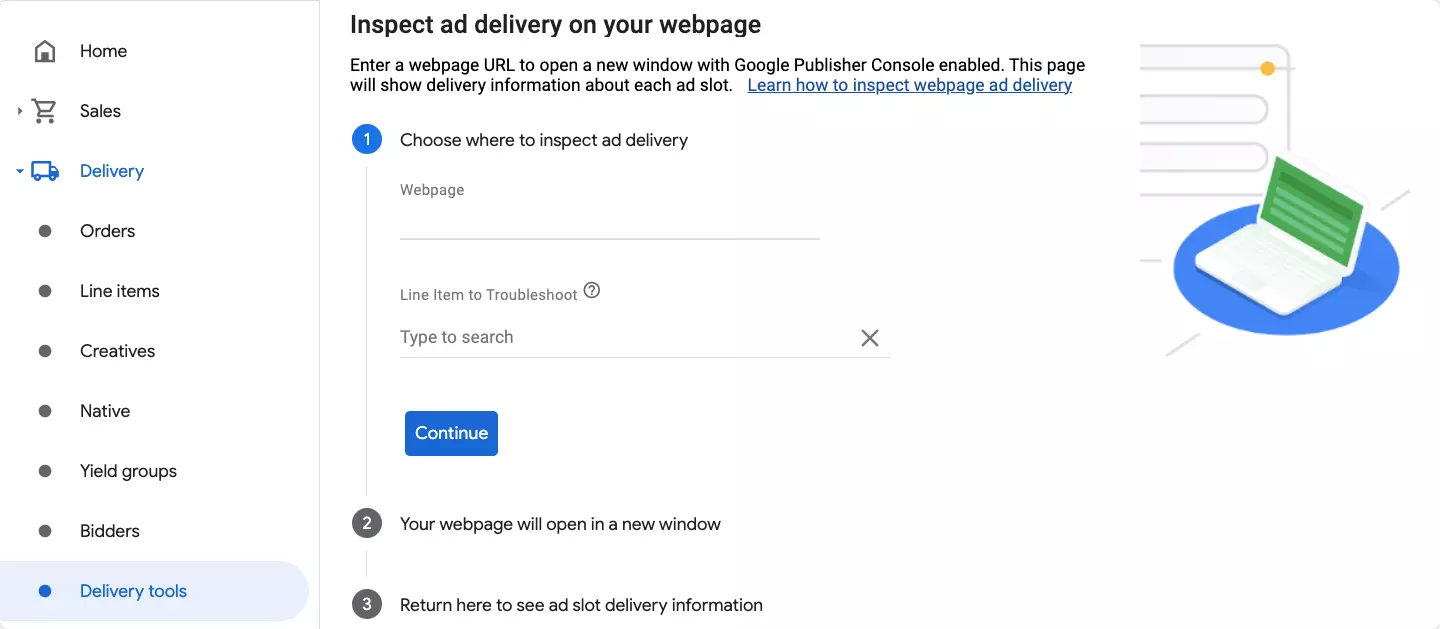
- Suppose you want to inspect a webpage ad and select the Webpage ads option.
- Now, enter your website URL in the given field. And click Continue. This will open your web page in a new tab with Google Publisher Console enabled.
- Go back to the Google Ad Manager tab. Here, you can see your ad slots with various details such as demand partners, line items/yield group names, etc.
- After executing the above steps, click on Inspect to check and know what went wrong with the ad slots. Also, you can Simulate ad requests to see which line item would win if you requested the slot again, or you also check which line item won the ad impression and why.
Using Google Publisher Console and Ad Manager to Inspect Performance of Ad Campaigns
As discussed above, Google Publisher Console can display various information such as page rendering with ads or without ads, winning auction type, etc., and many more details related to ad delivery. However, it offers partial data for ad slots and the performance of ads concerning their demand partners. So, you need to take the help of i.e., Google Ad Manager and Publisher Console simultaneously to understand the behavior of line items.
So, open Publisher Console and go to the Delivery tools in the Ad Manager in two different tabs, review the ad delivery and a list of other things listed below:
- Optimize the page speed – You can use the “Reload Page” option provided by the Publisher Console and analyze how ads affect your page load times. Load the page with ads, without ads, or without rendering ads, and check how much time demand partners take to return an ad request. This can help you know the channels responsible for page latency and find a solution.
- Debug ad tagging errors – The Console displays a warning if there is an error in the GPT or ad request. In such cases, you can check your ad tags and tagging codes and debug the issues with the help of developers.
- Check the performance of demand partners – You can check which demand partners have won the inventories and by which method the ads are placed (dynamic allocation, direct-sold, etc.). By clicking on it, you can view the ad and compare its performance with other demand partners (ad quality, page loading time, etc.).
Wrapping Up
Google Publisher Console is a good option for publishers or developers who prefer to debug and troubleshoot the issues themselves. The Console has multiple reasons to rely on – you can share the performance of various line items with the users who have access to your ad network, ask them for help to collaborate and troubleshoot line items, and many more. So, use the Google Publisher Console to discover and resolve the sources of unexpected ad delivery.
FAQs
What Is Google Publisher Console?
Google Publisher Console is a tool that helps publishers troubleshoot issues with their ads served by Ad Manager. It provides real-time data and insights into ad serving, delivery, and revenue.
How to Troubleshoot with Google Publisher Console?
To troubleshoot with the console, log in to your account, review the data provided, identify any issues, and take action to resolve them. Common issues that can be resolved using the console include ad latency, errors, and blocking.